Free AI Infographic Editor

Edit complex data visuals online in seconds — without expensive software, complex spreadsheets, or design degrees. Phygital+ AI infographic editor was made for marketers, analysts, and anyone who needs precise, clean data storytelling in a few clicks. Whether you're refining a quarterly report, retouching a chart, or fixing a brand palette, this tool gives you total control — all inside your browser.

New Project
Raw Data CSV
Prompt
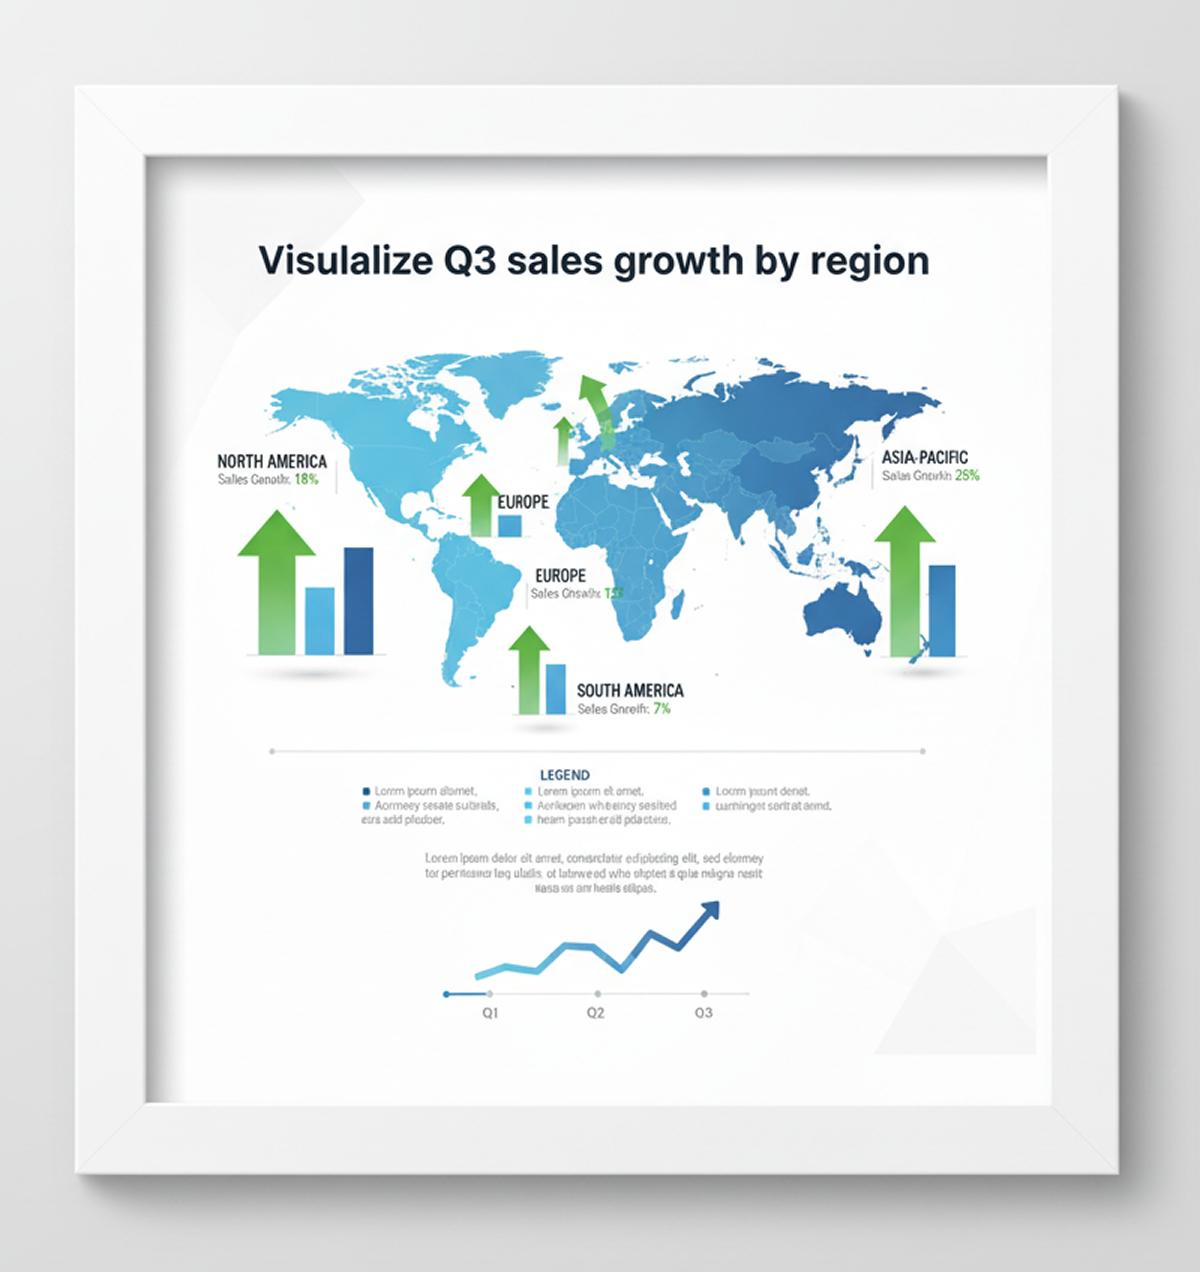
"Visualize Q3 sales growth by region..."
Generated Image December 22, 2025 - 3_55PM 1.png
Supported Byimage (6).png

What is an AI Infographic Editor?

Intelligent Data Parsing

The AI infographic editor is a professional-grade tool that uses artificial intelligence to read raw CSVs or JSONs. No manual entry—just clear, structured visual output.

Beyond Templates

You can smooth lines, adjust scale intensity, reshape pies, or remove outliers—all with precision and full visual control. The edits are subtle, responsive, and always editable.

For Creators

Whether you're tweaking content, refining typography, or preparing a PR campaign asset, this AI tool helps creators visualize data without design friction.

Why should you use the AI infographic editor?

High precision controls

Thanks to multi-model integration, you can work across different AI engines in one flow.

Edit everything, instantly

Remove noise, raise data points, reduce axis size, correct labels, or change visual styles instantly.

No install, no extra software

Everything works in your browser. Whether desktop or tablet, edits are saved locally.

Formats you actually use

Download results in PNG, JPG, or export ready high-res vectors for print or web. No watermarks.

From the chaos of data to a clear visual story.

Your idea deserves to be clear and complete. Our free AI infographic editor is designed to eliminate major obstacles.: the complexity of visualization, lack of design skills and time. It turns your thoughts and figures into compelling, professional visual materials.

Generated Image January 18, 2026 - 12_21AM 1.png
Problem

A single style for all visualizations

The data is in style chaos. When diagrams and diagrams are created in different programs or by different people, the visual language "breaks down". The fonts, palette, and style of the graphs don't match, and the resulting infographic looks like a collection of disparate elements. This reduces the clarity of the message and undermines the credibility of the data.

Solution

The editor who knows your style best. Upload the logo and brand guides. Our AI becomes a guarantor of integrity by automatically applying your corporate palette, typography, and rules to all elements, from histograms to pictographs. Each created infographic will be 100% brand-specific.

Generated Image January 18, 2026 - 12_22AM 1.png
Problem

Professional infographics in minutes, not for money

Data design is expensive and slow. Ordering complex infographics from a specialist requires time and a significant budget. Self-assembly in professional editors takes hours and requires skills. As a result, data visualization becomes a barrier, not a help.

Solution

Infographic designer in your browser. Is free. Create compelling, ready-to-publish infographics in minutes, not weeks and thousands of rubles. Our tool reduces the cost of this process to zero, saving the most valuable resources — analyst time and communication budget.

Generated Image January 18, 2026 - 12_24AM (1) 1.png
Problem

Fresh ideas to bring any data to life

A creative dead end in front of numbers. How to show boring statistics vividly and clearly? You have to use the same template schemes — pie charts and arrows— which makes the content predictable and uninviting. We need fresh formats, but they are difficult to come up with.

Solution

AI as your creative data analyst. Get hundreds of visualization options for a single dataset, from non-obvious comparisons and metaphorical illustrations to interactive compositions. The tool offers fresh ideas for packaging complex information, becoming a source of inspiration that always works within your brand and makes the data memorable.

How to edit infographics online

Editing a chart doesn't need to be hard or complicated. Here is a short tutorial for the start.

Upload CSV
1

Upload your data

Choose a dataset or spreadsheet, and write your prompt. If you are struggling with visualization, use our special text designer.

2

Pick a model and edit

Need to have slim bars? Soften a curve? Select the tool and dial it in. You can regenerate your chart or edit it as much as you want.
3

Save and use

See changes live, undo anything instantly, then download your result in different formats. No compression surprises.

Where can you use the AI chart editor?

Whether it's for contact, client work, or personal reports — the use cases are endless. The AI infographic editor adapts to your workflow, whether you're building a brand identity or polishing assets for a campaign.

  • ✦ Use the AI infographic editor for work reports, client presentations, and personal projects.
  • ✦ The AI—based chart editor is suitable for any task, from creating an identity to preparing a campaign.
  • ✦ The AI infographic editor adapts to your workflow, regardless of the purpose.
  • ✦ Use the chart editor for an endless range of tasks, from contact materials to professional reports.

Tips for achieving the best results

Small changes can make a big impact when editing data features. These tips will help you avoid common mistakes and keep your results looking natural and sharp. Whether you're retouching for personal use or a professional project, a thoughtful approach pays off.

  • ✦ Small adjustments to the data will keep the graphs natural and clear.
  • ✦ Accurate edits in the data will ensure a high-quality and professional result.
  • ✦ Thoughtful data editing helps to avoid errors in reports and presentations.
  • ✦ Minimal but thoughtful changes to the diagrams significantly improve their perception.

How to download and edit your image

Exporting your edited image is simple and flexible, whether you're sharing online or prepping for print. The tool gives you full control over resolution, file type, and final adjustments. You can revisit your edits anytime — no need to start over.

  • ✦ Download the image in the desired format and resolution, while maintaining the possibility of further editing.
  • ✦ Export the result, fully controlling the file settings for online publication or printing.
  • ✦ Save the image, if necessary, returning to the edits without losing progress.
  • ✦ Upload the final file, flexibly adjusting its quality and format to suit your needs.
Exporting...

Client Reviews

★★★★★

"Great tool as soon as you get used to it"

"At the beginning it was a bit challenging to understand from the workspace terms. But as soon as I spent about 10 mins trying to figure it out, I grasped the idea and now I feel like creating images for my presentations has never been easier."

Amy
★★★★★

"The best AI app out there"

"I can have all my favorite AI tools on one workspace, work with them from anywhere using a laptop and create awesome results in literally 2 minutes for my upcoming social media post, newsletter or a fun meme for my friends. Truly making me more creative and productive."

Peter
★★★★★

"Greatest tool for creators"

"It has a very flexible mechanisms of NN configuration and friendly UI. This project helped me to create different pictures according to my rich imagination."

Piotr
★★★★★

"Incredible efficiency"

"Generating assets for my campaigns used to take days. With this workspace, I'm done in hours. The quality is consistently high and the tools are intuitive."

Sarah
★★★★★

"Perfect for teams"

"We use this across our entire creative department. The shared workspace feature allows us to iterate on concepts in real-time without the usual friction."

Marcus
★★★★★

"Limitless creativity"

"The only limit is your imagination. The prompt understanding is better than any other model I've tested. Truly a premium tool for professionals."

Jessica

Best AI Tools All in One Place

Placeholder image

GPT Image

AI image generation & editing

Sora 2

Cinematic video generation

Google_2015_logo 1.svg

Imagen 4

Ultra-sharp images

Gemini 2.5 / 3.0

Multimodal generation & editing

Veo 3.1

Fast video + motion consistency

Logo_runway.svg

Gen 4

Best for consistent characters & video frame generations

Aleph

Video editing & effects

Midjorny.svg

MidJourney

Image generation & variations

Upscale / Outpaint / Pan

Advanced editing tools

Logo_hailuo.svg

Hailuo 2 Pro

High-quality video animation

Logo_king.svg

Kling 2.5

v1, v1.5, v1.6, v2 video generation

Explore similar use cases

AI Book Cover Generator

Create compelling book and eBook covers from synopsis + genre

AI Event Visual Generator

Design banners, posters, and ads for concerts, festivals, or workshops

AI Social Template Generator

Build branded Canva/Figma-style templates with AI

AI Brand Visual Consistency Tool

Generate all brand visuals (ads, headers, icons) in a unified style

FAQs

Answers to common questions about using Phygital+ and editing infographics with AI.

How can I build data visualization workflows in Phygital+?

-
Create this pipeline: GPT-4o (analyzes data + suggests visualization) → Prompt Generator → GPT Image/Imagen (generates charts) → FLUX (custom backgrounds) → Compose (layers elements) → Upscale Image. Connect nodes to turn raw data insights into professional infographics. Save workflow for monthly reports.

What's the best way to maintain brand consistency across 100+ infographics?

+

Can Phygital+ generate custom icons for my infographics?

+

How do I create infographics for both social media and reports?

+

Can I automate monthly infographic generation in Phygital+?

+

Start for free

Create logos, mockups, and brand visuals in one place.

New
100%